torch.meshgrid
-
torch.meshgrid(*tensors)[source]¶ Creates grids of coordinates specified by the 1D inputs in attr:tensors.
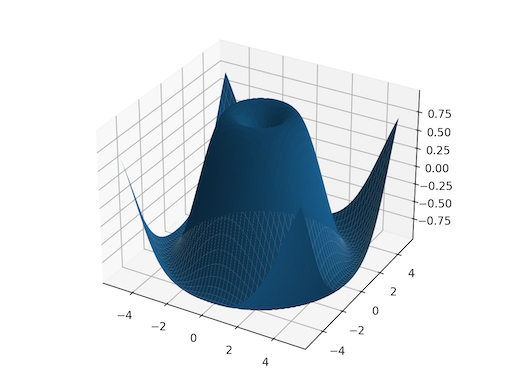
This is helpful when you want to visualize data over some range of inputs. See below for a plotting example.
Given 1D tensors as inputs with corresponding sizes , this creates N-dimensional tensors , each with shape where the output is constructed by expanding to the result shape.
Note
0D inputs are treated equivalently to 1D inputs of a single element.
Warning
torch.meshgrid has the same behavior as calling numpy.meshgrid(…, indexing=’ij’), and in the future torch.meshgrid will also support the indexing argument.
https://github.com/pytorch/pytorch/issues/50276 tracks this issue with the goal of migrating to NumPy’s behavior.
See also
torch.cartesian_prod()has the same effect but it collects the data in a tensor of vectors.- Parameters
tensors (list of Tensor) – list of scalars or 1 dimensional tensors. Scalars will be treated as tensors of size automatically
- Returns
If the input has tensors of size , then the output will also have tensors, where each tensor is of shape .
- Return type
seq (sequence of Tensors)
Example:
>>> x = torch.tensor([1, 2, 3])
>>> y = torch.tensor([4, 5, 6])

Observe the element-wise pairings across the grid, (1, 4),
(1, 5), ..., (3, 6). This is the same thing as the
cartesian product.
>>> grid_x, grid_y = torch.meshgrid(x, y)
>>> grid_x
tensor([[1, 1, 1],
        [2, 2, 2],
        [3, 3, 3]])
>>> grid_y
tensor([[4, 5, 6],
        [4, 5, 6],
        [4, 5, 6]])

This correspondence can be seen when these grids are
stacked properly.
>>> torch.equal(torch.cat(tuple(torch.dstack([grid_x, grid_y]))),
...             torch.cartesian_prod(x, y))
True

`torch.meshgrid` is commonly used to produce a grid for
plotting.
>>> import matplotlib.pyplot as plt
>>> xs = torch.linspace(-5, 5, steps=100)
>>> ys = torch.linspace(-5, 5, steps=100)
>>> x, y = torch.meshgrid(xs, ys)
>>> z = torch.sin(torch.sqrt(x * x + y * y))
>>> ax = plt.axes(projection='3d')
>>> ax.plot_surface(x.numpy(), y.numpy(), z.numpy())
<mpl_toolkits.mplot3d.art3d.Poly3DCollection object at 0x7f8f30d40100>
>>> plt.show()